Abstract close-up of overlapping black geometric shapes with smooth curved surfaces and subtle highlights.

Cosmo Half-Year Report 2026

1.1 Cosmo Mission and Vision

Building Health Confidence

Mission

We empower patients, healthcare professionals and partners with life-changing confidence by innovating at the intersection of science and technology.

Vision

To advance innovation in Life Sciences by developing new therapies and technologies, supported by AI, digital health, and an entrepreneurial approach. From molecule to manufacturing, we turn possibility into product, led by people who care.

Certain Defined Terms: In this report, unless otherwise specified, the terms ‘we’, ‘our’, ‘us’, ‘the Company’, ‘the Group’ and ‘Cosmo’ refer to Cosmo N.V., together with its subsidiaries, or any one or more of them, as the context may require.

Some of the statements in this publication may be forward-looking statements or statements of future expectations based on currently available information. Such statements are naturally subject to risks and uncertainties. Factors such as the development of general economic conditions, future market conditions, unusual catastrophic loss events, changes in the capital markets and other circumstances may cause the actual events or results to be materially different from those anticipated by such statements. Cosmo does not make any representation or warranty, express or implied, as to the accuracy, completeness or updated status of such statements. Therefore, in no case whatsoever will Cosmo and its affiliate companies be liable to anyone for any decision made or action taken in conjunction with the information and/or statements in this publication or for any related damages.

1.2 Highlights

H1 2026 Highlights

Abstract network symbol with eight spokes radiating from a central point, each ending in a circular node.

Medtech AI

GI Genius™

GI Genius continues to evolve from a best-in-class AI detection system into a connected procedural intelligence platform, with continued progress across clinical validation, workflow integration, next-generation visualisation, and product innovation. 

  • A landmark real-world study published in Gastroenterology, which evaluated more than 334,000 colonoscopies across the U.S. Veterans Health Administration, further validated the clinical effectiveness of GI Genius in routine practice, reinforcing the growing body of evidence supporting AI-assisted endoscopy.
  • Cosmo continues to expand its healthcare connectivity ecosystem through collaboration with a leading global electronic medical record provider and ongoing clinical integration pilots. These initiatives advance interoperability between GI Genius and endoscopy reporting workflows, laying the foundation for a more connected procedural intelligence platform.
  • Cosmo continues to advance integration of GI Genius with Apple Vision Pro following completion of the first-of-its-kind usability study at Rush University. Study results were presented at an international augmented reality conference in Leipzig, Germany, demonstrating the potential for immersive visualisation of real-time AI insights during colonoscopy.
  • Following EU MDR certification of ColonPRO EU, Cosmo continues to advance launch readiness and commercialisation of its most advanced AI-assisted colonoscopy platform in Europe. ColonPRO EU integrates four complementary AI modules for real-time detection, characterisation, sizing, and quality assessment.  
Three horizontal connected-node symbols stacked vertically, each featuring three circular nodes linked by straight lines.

Derma

Winlevi®

Remains the No.1 Branded Topical Acne Product in the U.S., maintaining its strong market position.

  • Over 1.8 million prescriptions generated through the end of H1 2026 since the November 2021 launch, confirming its sustained dominance in the U.S. market.
  • The product received approval from the European Medicines Agency (EMA) in Autumn 2025 and has been launched in 11 countries between April and June 2026, with further launches planned for later in the year.
  • Winlevi continues its global expansion following successful launches across key markets, including the United States, Canada, Australia, New Zealand, the United Kingdom, Singapore, Malaysia, Jordan, and the Republic of Korea. Regulatory approvals secured in Kuwait, Qatar, and Egypt in 2025, alongside recent approvals in Saudi Arabia, Oman, Bahrain, and the Philippines, pave the way for further commercial launches in 2026. In Canada, Winlevi has achieved top-three brand status in acne therapy by sales and is the second fastest-growing brand in the category.
  • Expansion efforts remain active across Europe, Central America, and South America, supported by a growing network of strategic partnerships.
  • Winlevi sales achieved double-digit growth, supported by successful launches in new markets and sustained momentum across existing commercial markets.
Two contrasting network diagrams: an open zigzag path of connected nodes on the left and a structured grid of connected nodes on the right.

Gastro & CDMO

Amid strong generic competition, several products delivered solid double-digit growth.

  • In August 2025, Cosmo renewed its multi-year manufacturing and supply agreement with Takeda for Mesalazine MMX® 1200 mg (marketed as Lialda® in the U.S. and Mezavant® in Europe). The product delivered double-digit growth across all markets in H1 2026.
  • The CDMO business achieved double-digit growth in H1 2026, driven by new customer projects that successfully progressed from the R&D phase into commercial supply, generating incremental revenues.
  • The Company is actively evaluating new strategic, value-accretive CDMO partnerships to further expand its manufacturing capabilities and growth opportunities.

Our Pipeline Targets Large Unmet Clinical Needs

Zigzag path of connected circular nodes arranged in three horizontal rows.

Androgenetic Alopecia

Status updates as at H1 2026

Positive 12-month results confirming long-term safety, continued efficacy with ongoing use and a novel mechanism designed to target the underlying biology of hair loss.

Both NDA and MAA preparations are underway with U.S. filing planned for early 2027.

Patient size (WW)

1.2–2B

TAM (WW)

~ €28B

Drug development timeline progressing through Pre-clinical, Phase 1, Phase 2 and Phase 3 stages.
Zigzag path of connected circular nodes arranged in three horizontal rows.

Distal Ulcerative Colitis

Status updates as at H1 2026

Recruitment and treatment phases completed.
Top-line results expected Q4 2026.

Patient size (WW)

3.5M

TAM (WW)

~ €1.1B

Drug development timeline showing completed Pre-clinical and Phase 1 stages, with progress through Phase 2 and Phase 3 yet to begin.
Zigzag path of connected circular nodes arranged in three horizontal rows.

Bile Acid Diarrhoea

Status updates as at H1 2026

The Phase 2 clinical study is underway across 26 sites, with additional sites expected in H2 2026.

Patient size (WW)

95M

TAM (WW)

~ €21B

Drug development timeline showing completed Pre-clinical and Phase 1 stages, with early progress through Phase 2 and Phase 3 yet to begin.
Three horizontal connected-node symbols stacked vertically, each consisting of three circular nodes linked by straight lines.

Solid Tumours

Status updates as at H1 2026

The Phase I(a) dose-escalation study has successfully concluded, and enrolment is now paused.
Comprehensive safety and efficacy data are undergoing statistical analysis.

Patient size (WW)

~ 1M

TAM (WW)

~ €8B

Drug development timeline showing completed Pre-clinical stage, with progress through Phase 1 and Phases 2 and 3 yet to begin.
Abstract network symbol with eight spokes radiating from a central point, each ending in a circular node.

MedTech Al

TAM

€4.4B

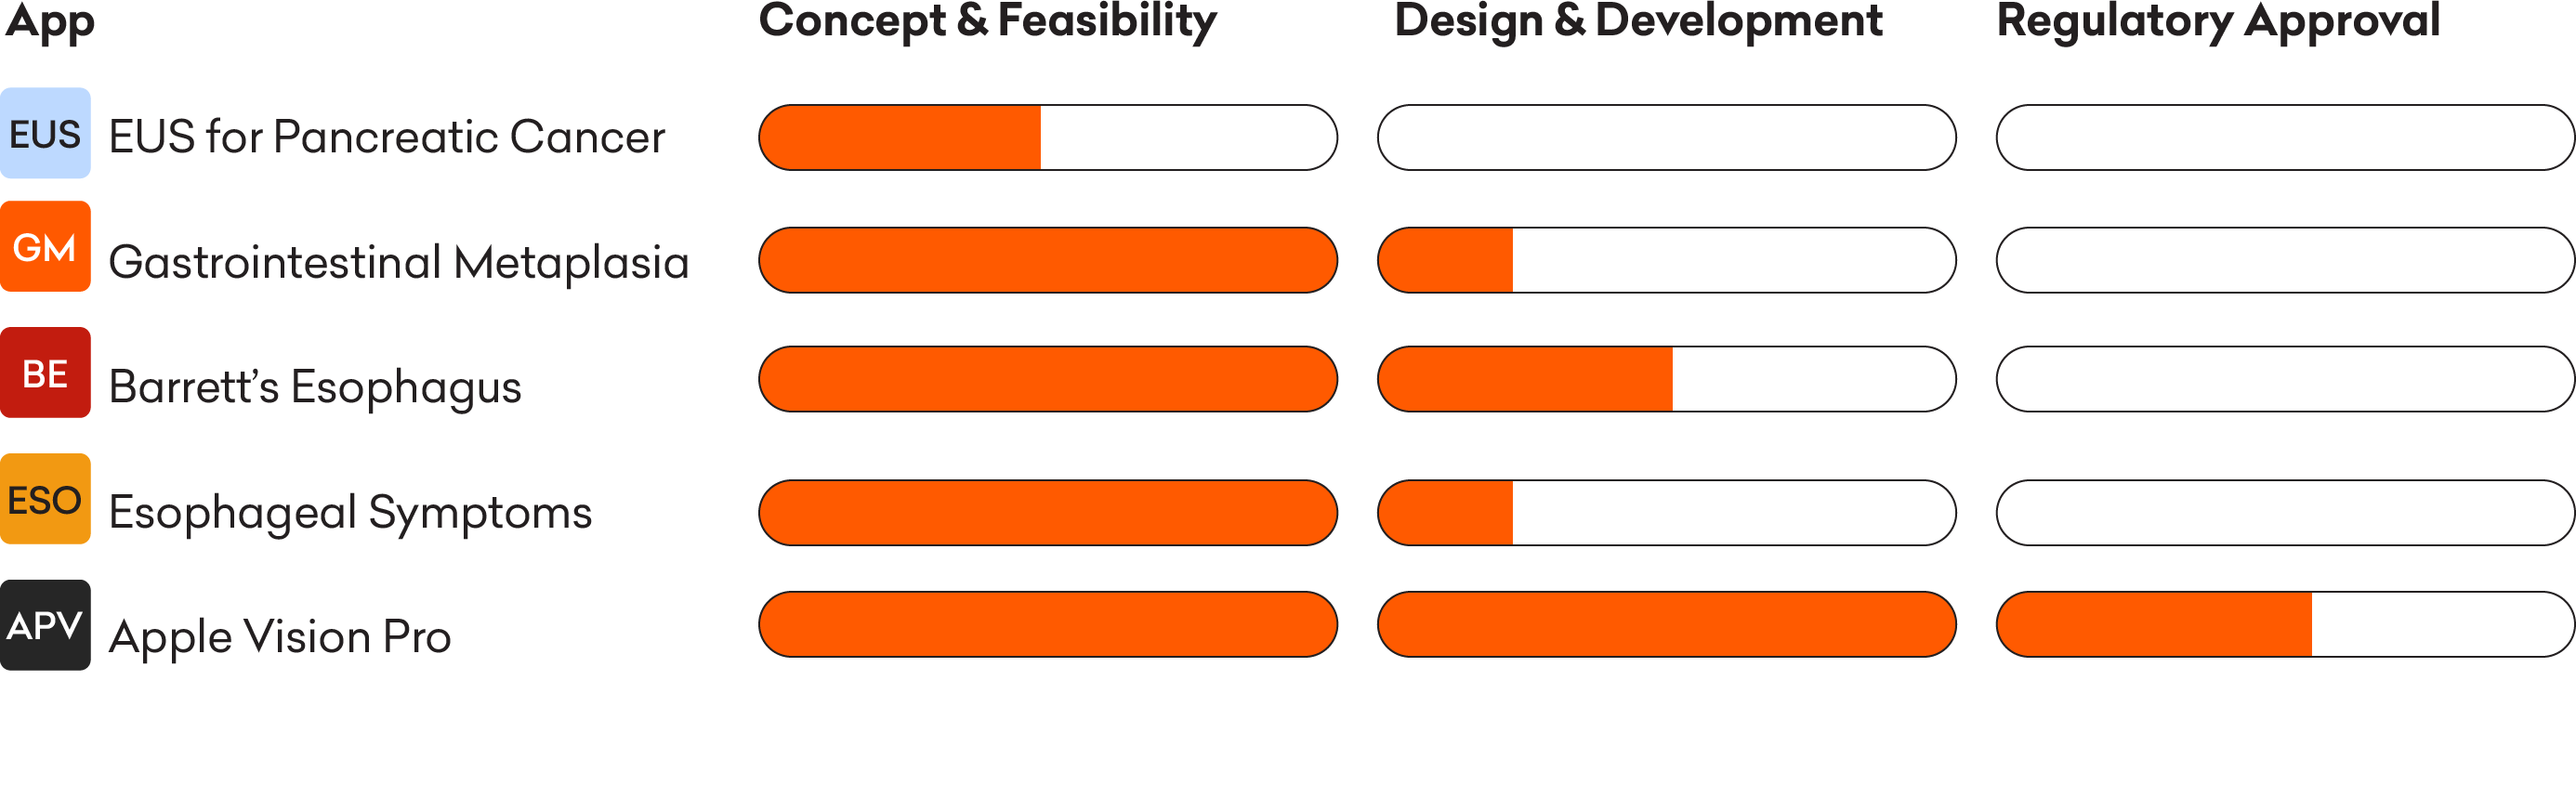
App development pipeline showing progress across Concept & Feasibility, Design & Development, and Regulatory Approval for EUS for Pancreatic Cancer, Gastrointestinal Metaplasia, Barrett's Esophagus, Esophageal Symptoms, and Apple Vision Pro.

1.3 Financial Highlights

H1 2026 Highlights

Revenue

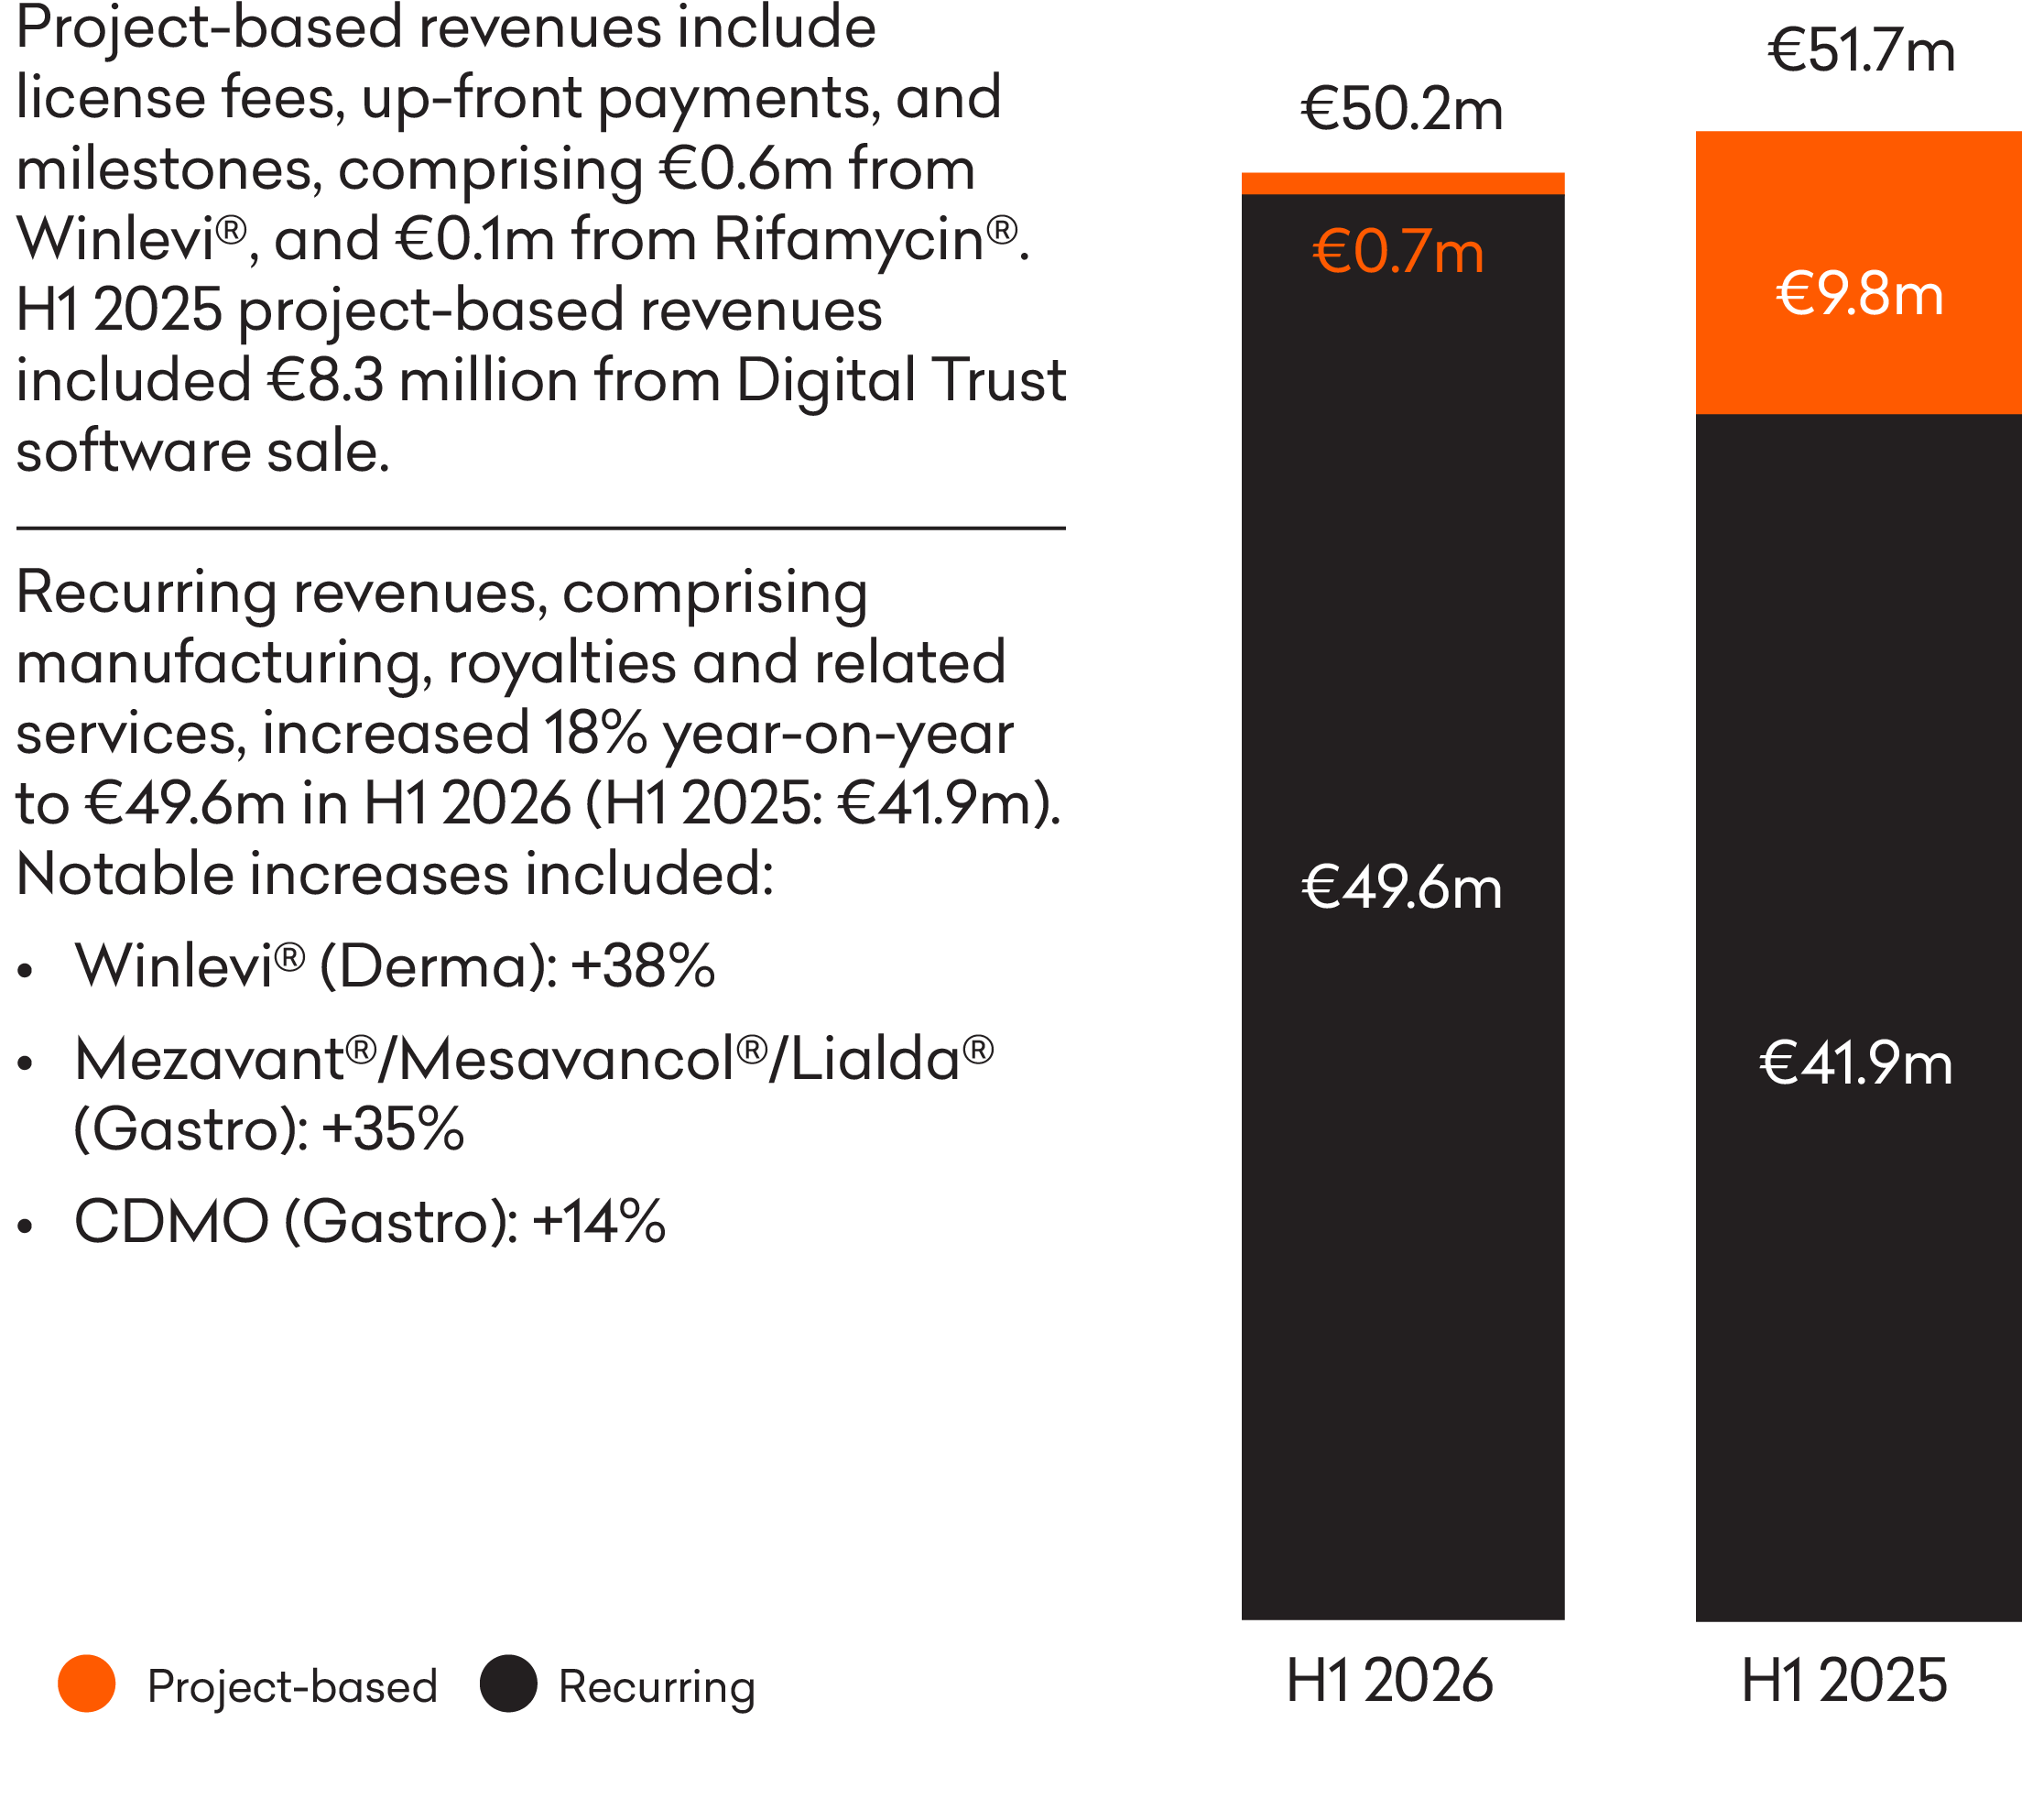
€50.2m

€49.6m Recurring: +18% YoY growth

€0.7m Project-based

Revenue comparison showing H1 2026 total revenue of €50.2m, comprising €49.6m recurring and €0.7m project-based revenue, versus €51.7m in H1 2025, comprising €41.9m recurring and €9.8m project-based revenue.

Operating loss

(€6.6m)

H1 2025: (€1.4m) 

Loss before tax

(€3.8m)

H1 2025: (€0.7m) 

EBITDA1

(€0.0m)

H1 2025: €4.9m

Cash, equivalents and investments2

€205.1m

31 December 2025: €128.3m

Treasury shares
(at market value)

€25.5m

31 December 2025: €152.8m

Equity attributable to owners
of the Company

€565.3m

31 December 2025: €482.3m

1 EBITDA (Earnings before net financial items, tax, depreciation and amortisation) is calculated as operating profit/(loss), plus depreciation and amortisation.

2 Excluding investment in equity instruments

2. Directors’ Report

2.1 CEO Statement

Dear Shareholders,

A year ago, we told you Cosmo would move from transition to execution, from ambition to delivery, from potential to performance. The first half of this year demonstrates the strength of our execution. We did what we said we would do, and we did it with discipline.

Cosmo today is a focused healthcare company built around three core strengths: innovation in gastroenterology, leadership in dermatology, and a growing digital and AI platform designed to scale across MedTech and pharma. Our strategy is clear. Our priorities are disciplined. Our execution is accelerating.

In dermatology, Winlevi continued its expansion and now reaches patients in more markets than ever, while Clascoterone advanced through Phase 3 as our largest dermatology opportunity, built on a mechanism no incumbent can copy. In gastroenterology, we continued to build on our foundation of proprietary products, with GI Genius extending its reach through our partnership with Medtronic. And across both our therapeutic areas, our AI and digital capability moved from promise to platform. These are not experiments. They are strategic assets, designed to enhance clinical performance, support our partners, and scale globally.

We continued to invest where we see long term value and to hold the line on further investment where we do not. This discipline, in capital, in focus, and in execution, is now embedded across the company. We also continued to strengthen our leadership team and governance to support this next phase of growth, building a culture that values accountability, speed, and ownership, where decisions are informed by data and by the people we serve.

Looking ahead, our priorities remain simple yet demanding.

We will execute on our pipeline with rigor and discipline.

We will scale our digital and AI platforms with the right partners.

We will allocate capital with a clear focus on returns and long-term value.

We will continue to raise the bar on performance, transparency, and governance.

None of this is drift. It is Vision 2030, on plan. Cosmo has a strong balance sheet, a differentiated portfolio, and a clear strategic direction. Most importantly, we have a team that is fully aligned behind our goals and committed to delivering results. I am confident in Cosmo’s trajectory and in the opportunities ahead. We are building a company designed not just to grow, but to prosper.

Thank you for your continued trust and support.

Sincerely,

Giovanni Di Napoli

Chief Executive Officer

Cosmo N.V.

Giovanni Di Napoli, Chief Executive Officer of Cosmo N.V.

2.2 Financial Review

Income statement

EUR 1,000

H1 2026

H1 2025

Revenue

50,235

51,720

Net expenses

(56,842)

(53,131)

Operating loss

(6,607)

(1,411)

Net financial income

2,819

741

Loss before taxes

(3,788)

(670)

Income tax

(943)

(1,360)

Loss after taxes for the period

(4,731)

(2,030)

EBITDA

(5)

4,852

Revenue

EUR 1,000

H1 2026

H1 2025

GI Genius™ (Medtech AI)

9,157

8,714

Winlevi® (Derma)

10,215

7,409

Lialda®/Mezavant®/Mesavancol®

18,994

14,035

Uceris®/Cortiment®

2,356

2,416

Contract manufacturing (CDMO)

7,766

6,789

Others

1,094

1,982

Gastro & CDMO

30,210

25,222

Other revenue

580

Recurring revenue

49,582

41,925

Project-based revenue

653

9,795

Total revenue

50,235

51,720

Recurring Revenue

H1 2026 recurring revenue increased by 18% to €49.6 million (H1 2025: 41.9 million), driven by growth across Derma, Gastro & CDMO and Medtech AI. 

Gastro & CDMO increased by 20% to €30.2 million (H1 2025: €25.2 million), mainly due to higher volumes for Lialda/Mezavant/Mesavancol and contract manufacturing. Winlevi (Derma) recurring revenue increased by 38% to €10.2 million (H1 2025: €7.4 million) arising from increase in both supply revenues and royalties. GI Genius (Medtech AI) recurring revenue increased by 5% to €9.2 million in H1 2026 (H1 2025: €8.7 million), primarily driven by higher supply volumes. As anticipated, the timing of production scale-up and the phased deployment of Module 300 resulted in a greater share of revenues being recognised in the second half of the year. The Company therefore continues to expect double-digit growth for the GI Genius™ business in both the second half of 2026 and the full year.

Project-based Revenue

Project-based revenue in H1 2026 was €0.7 million (H1 2025: €9.8 million), comprising €0.6 million from Winlevi (Derma) milestone and €0.1 million for Rifamycin milestone. Project-based revenue in H1 2025 was attributed to the €8.3 million sale of Digital Trust software.

Net operating expenses

Net operating expenses were €56.8 million (H1 2025: €53.1 million), comprising the following:

  • Other income decreased to €2.8 million (H1 2025: €4.1 million),  mainly comprising dividend income of €2.3 million (H1 2025: €3.3 million) from the Group's equity investment in RSouth Antibodies B.V. and €0.4 million (H1 2025: €0.6 million) of R&D tax credits and grants. 

  • Cost of sales increased to €27.9 million (H1 2025: €25.6 million) mainly due to higher recurring revenues. 

  • Research and development (R&D) costs decreased to €15.1 million (H1 2025: €18.0 million) primarily due to lower expenditures on Clascoterone 5% solution for androgenetic alopecia in males, following the completion of clinical trials. 

  • Selling, general and administrative (SG&A) costs increased to €16.6 million (H1 2025: €13.7 million). The increase primarily reflects non-cash amortisation related to the European commercialisation rights for Winlevi®, together with the full-period impact of investments made during the second half of 2025 to strengthen the Company's corporate capabilities and support its growth strategy.

For more details, refer to section 3.6 Notes to the Condensed Consolidated Financial Statements

Cash flow and liquidity

EUR 1,000

H1 2026

H1 2025

Loss for the period before tax

(3,788)

(670)

Adjustment for non-monetary item

7,434

7,905

Operating cash flows before changes in working capital

3,646

7,235

Change in net working capital

(10,438)

(6,024)

Cash flows from operating activities

(6,792)

1,211

Income taxes paid

(765)

(311)

Net cash flows from operating activities

(7,557)

900

Investments in property, plant and equipment (‘PPE’)

(2,181)

(2,624)

Investments in other intangible assets

(660)

(627)

Net inflows/(outflows) from the investment in/disposal of financial assets

(100,423)

45,225

Cash flows from investing activities

(103,264)

41,974

Payment of loans, leases and related interests

(438)

(498)

Distributions paid

(36,108)

(24,512)

Net cashflows from stock option exercise

(441)

-

Sale/(purchase) of treasury shares – net

122,433

(4,693)

Payment of contingent consideration liability

-

(4,500)

Cash flows from financing activities

85,446

(34,203)

Net increase/(decrease) in cash and cash equivalents

(25,375)

8,671

Cash and cash equivalents at the beginning of the period (at 31 Dec. 2025)

55,865

44,296

Net foreign exchange difference on cash and cash equivalents

285

(2,218)

Total cash and cash equivalents at the end of the period  (at 30 Jun. 2026)

30,775

50,749

EUR 1,000

30-Jun-26

31-Dec-25

Cash and cash equivalents

30,775

55,865

Short-term investments in funds and bonds

163,902

66,894

Long-term investments in bonds

10,472

5,580

Total cash, equivalents and investments1

 205,149

 128,339

1 Excluding investment in equity instruments

As of 30 June 2026, the Group’s liquidity comprises of €30.8 million cash and cash equivalents and a total of €174.4 million investments in funds and bonds, of which €163.9 million are investments in funds and bonds that mature within 12 months from 30 June 2026 and €10.5 million are investments in bonds that mature in 2028 and 2029.

Net cash outflow from operating activities was €7.6 million in H1 2026, compared with a net cash inflow of €0.9 million in H1 2025. Operating cash flow before changes in working capital amounted to €3.6 million (H1 2025: €7.2 million). The period's cash outflow primarily reflected a working capital outflow of €10.4 million, driven mainly by increases in inventories and trade receivables, partially offset by an increase in trade payables. Net income tax payments amounted to €0.8 million, while non-cash adjustments totalled €7.4 million. Cashflows in H1 2025 included the proceeds from the Digital Trust software sale.

Investments in property, plant and equipment totalled €2.2 million (H1 2025: €2.6 million net cash outflow). These primarily relate to €1.4 million for new office refurbishments, €0.3 million for new plant, machinery and equipment to support increased production, and €0.5 million for other capital expenditure. Investments in intangible assets amounted to €0.7 million (H1 2026: €0.6 million) and mainly related to patents and rights. Net outflow from financial assets were €100.4 million (H1 2025: €45.2 million net inflow), reflecting the net effect of new investment in funds and bonds amounting to €116.4 million, sale of investments  of €15.8 million and interest received of €0.2 million.

Financing activities generated a net cash inflow of €85.4 million in H1 2026 (H1 2025: €34.2 million outflow). The cash inflow is mainly driven by the private placement of treasury shares in February 2026, partly offset by the dividends paid during the period.

2.3 Responsibility Statement

In accordance with Section 5:25d(2)(c) of the Dutch Financial Supervision Act, the Board of Directors of the Company hereby declare that, to the best of their knowledge:

  • the Half-Year Condensed Consolidated Financial Statements as of and for the six months ending 30 June 2026 give a true and fair view of the assets, liabilities, financial position and the profit/(loss) of the Company and its consolidated entities; and
  • the mid-year Directors’ Report for the first half of this financial year gives a true picture of:
    • the most important events which have occurred in the first six months of this financial year and of the effect of those on the mid-year financial statements;
    • the most important transactions with related parties which were entered into during this period; and
    • the main risks and uncertainties for the remaining six months of the financial year in question.

The Board of Directors

Mauro Ajani

Alessandro Della Chà

Giovanni Di Napoli

John O’Dea

Silvana Perretta

Maria Grazia Roncarolo

Dublin, Ireland, 21 July 2026

3. Condensed Consolidated
Financial Statements
And Notes

3.1 Condensed Consolidated Income Statement (unaudited)

For the six months ended 30 June 2026

EUR 1,000

Notes

H1 2026

H1 2025

Revenue

4

50,235

51,720

Cost of sales

(27,904)

(25,571)

Gross profit

 22,331

26,149

Other income

5

2,830

4,123

Research and development costs

(15,136)

(17,997)

Selling, general and administrative costs

(16,632)

(13,686)

Net operating expenses

(28,938)

(27,560)

Operating loss

(6,607)

(1,411)

Financial income

6

3,223

3,242

Financial expenses

6

(404)

(2,501)

Net financial income

 2,819

741

Loss before taxes

 (3,788)

(670)

Income tax

7

(943)

(1,360)

Loss for the period

 (4,731)

(2,030)

Loss attributable to:

Owners of the Company

(4,750)

(2,006)

Non-controlling interest

19

(24)

Loss per share:

EUR

EUR

Basic

8

(0.279)

(0.126)

Diluted

8

(0.279)

(0.126)

The accompanying notes form an integral part of the Half-Year Condensed Consolidated Financial Statements.

3.2 Condensed Consolidated Statement of Comprehensive Income (unaudited)

For the six months ended 30 June 2026

EUR 1,000

Notes

H1 2026

H1 2025

Loss for the period (A)

(4,731)

(2,030)

Other comprehensive income/(loss)

Items that will not be reclassified subsequently to profit or loss

Gain/(loss) on equity instruments measured at FVOCI

(563)

162

Remeasurement of defined benefit liability

(1)

(2)

Total items that will not be reclassified subsequently to profit or loss (B1)

(564)

160

Items that may be reclassified subsequently to profit or loss

Exchange differences on translating foreign operations

340

125

Gain/(loss) on debt instruments measured at FVOCI

(2)

(241)

Income tax

7

185

19

Total items that may be reclassified subsequently to profit or loss (B2)

523

(97)

Total other comprehensive income/(loss), net of tax (B1+B2)=(B)

(41)

63

Total comprehensive loss (A)+(B)

(4,772)

(1,967)

Total comprehensive loss attributable to:

Owners of the Company

(4,791)

(1,943)

Non-controlling interest

19

(24)

The accompanying notes form an integral part of the Half-Year Condensed Consolidated Financial Statements.

3.3 Condensed Consolidated Statement of Financial Position (unaudited)

As at 30 June 2026

EUR 1,000

Notes

30-Jun-26

31-Dec-25

ASSETS

Non-current assets

Property, plant and equipment

30,738

30,806

Goodwill

9

24,005

24,005

Other intangible assets

10

322,036

325,883

Financial assets

11

21,687

17,335

Deferred tax assets

20,879

19,891

Other receivables and other assets

11,637

11,438

Total non-current assets

430,982

429,358

Current assets

Inventories

13,455

10,427

Trade receivables

29,715

24,143

Current tax and other tax assets

6,869

8,250

Other receivables and other assets

17,784

17,700

Current financial assets

11

163,902

66,894

Cash and cash equivalents

30,775

55,865

Total current assets

262,500

183,279

TOTAL ASSETS

693,482

612,637

EQUITY

Share capital

12

4,562

4,562

Share premium

243,565

243,565

Reserves

(14,471)

(81,929)

Retained earnings

331,606

316,102

Equity attributable to owners of the Company

565,262

482,300

Non-controlling interest

6,690

6,879

TOTAL EQUITY

12

571,952

489,179

LIABILITIES

Non-current liabilities

Interest-bearing loans and borrowings

13

3,588

3,556

Employee benefits

602

581

Deferred tax liabilities

91,962

93,000

Other non-current liabilities

14

757

799

Total non-current liabilities

96,909

97,936

Current liabilities

Interest-bearing loans and borrowings

13

726

709

Trade payables

14,157

11,327

Current tax liabilities

848

617

Other current liabilities

14

8,890

12,869

Total current liabilities

24,621

25,522

TOTAL LIABILITIES

121,530

123,458

TOTAL EQUITY AND LIABILITIES

693,482

612,637

The accompanying notes form an integral part of the Half-Year Condensed Consolidated Financial Statements.

3.4 Condensed Consolidated Cash Flow Statement (unaudited)

For the six months ended 30 June 2026

EUR 1,000

Notes

H1 2026

H1 2025

Loss for the period before tax

(3,788)

(670)

Adjustments for:

Depreciation and amortisation

5

6,602

6,263

Share-based payment expenses

15

1,788

1,228

Financial income from investments - net

(1,631)

(1,823)

Change in employee benefits/pension provision

21

(106)

Decrease in fair value of contingent consideration liability

14

(45)

Unrealised foreign exchange gain on cash and investments


55

2,343

Loss on write-off and disposal of intangible assets and fixed assets

423

Operating cash flows before changes in working capital

3,646

7,235

Change in inventories

(3,027)

1,131

Change in trade receivables

(5,572)

(2,675)

Change in trade payables

2,830

457

Change in other receivables and other assets

(84)

(608)

Change in other liabilities

(3,979)

(3,777)

Change in current and deferred tax assets/liabilities

(808)

(1,142)

Change in withholding tax receivables

202

590

Cash flows from operating activities

(10,438)

1,211

Income taxes paid (net)

(765)

(311)

Net cash flows from operating activities

(7,557)

900

Investments in property, plant and equipment (excluding right-of-use assets)

(2,181)

(2,624)

Investments in other intangible assets

(660)

(627)

Investments in bonds and funds

(116,390)

(23,287)

Proceeds from disposal of investments in bonds and funds

15,802

67,784

Interest received from investments

165

728

Cash flows from investing activities

(103,264)

41,974

Repayments of loans and leases and related interests

(438)

(498)

Purchase of treasury shares

12(B)

(4,609)

(7,915)

Sale of treasury shares

12(B)

127,042

3,222

Distributions to shareholders

(36,108)

(24,512)

Net cashflows from stock option exercise

(441)

Payment of contingent consideration liability

(4,500)

Cash flows from financing activities

(85,446)

(34,203)

Net increase/(decrease) in cash and cash equivalents

(25,375)

8,671

Cash and cash equivalents at the beginning of the period

55,865

44,296

Net foreign exchange differences

285

(2,218)

Cash and cash equivalents at the end of the period

30,775

50,749

Cash at hand

7

7

Bank accounts

30,768

50,742

Total cash and cash equivalents at the end of the period

30,755

50,749

The accompanying notes form an integral part of the Half-Year Condensed Consolidated Financial Statements.

3.5 Condensed Consolidated Statement of Changes in Equity (unaudited)

For the six months ended 30 June 2026

Attributable to owners of the Company

EUR 1,000

Number
of shares
(n)

Share capital

Share premium

Legal and other
reserves

Treasury shares

Share-based Payment Reserve

Fair value reserve

Employee benefits actuarial

gains/losses reserve

Currency translation reserve

Retained earnings

Total

Non-controlling interests

Total equity

Net equity as at 1 January 2026

17,543,522

4,562

243,565

50,532

(91,718)

7,999

(49,516)

(212)

986

316,102

482,300

6,879

489,179

Total comprehensive income/(loss) for the period

Profit/(loss) for the period

(4,750)

(4,750)

19

(4,731)

Other comprehensive income/(loss) for the period

(380)

(1)

340

(41)

(41)

Total comprehensive income/(loss)
for the period

(380)

(1)

340

(4,750)

(4,791)

19

(4,772)

Transactions with owners
of the Company

Cash distribution/dividends payment

(36,108)

(36,108)

(208)

(36,316)

Stock option costs

1,330

1,330

1,330

PSU and RSU costs

458

458

458

Expired stock options

(72)

72

Exercise of stock options

418

(440)

(419)

(441)

(441)

Sale of treasury shares – net

65,805

56,629

122,434

122,434

Others

80

80

80

Total transactions with owners
of the Company

66,223

1,276

20,254

87,753

(208)

87,545

Net equity as at 30 June 2026

17,543,522

4,562

243,565

50,532

(25,495)

9,275

(49,896)

(213)

1,326

331,606

565,262

6,690

571,952

The accompanying notes form an integral part of the Half-Year Condensed Consolidated Financial Statements.

For the six months ended 30 June 2025

Attributable to owners of the Company

EUR 1,000

Number
of shares
(n)

Share capital

Share premium

Legal and other
reserves

Treasury shares

Share-based Payment Reserve

Fair value reserve

Employee benefits actuarial

gains/losses reserve

Currency translation reserve

Retained earnings

Total

Non-controlling interests

Total equity

Net equity as at 1 January 2025

17,543,522

4,562

243,565

50,532

(104,109)

34,364

(54,285)

(221)

858

323,064

498,330

6,761

505,091

Total comprehensive income/(loss) for the period

Profit/(loss) for the period

(2,006)

(2,006)

(24)

(2,030)

Other comprehensive income/(loss) for the period

(60)

(2)

125

63

63

Total comprehensive income/(loss)
for the period

(60)

(2)

125

(2,006)

(1,943)

(24)

(1,967)

Transactions with owners
of the Company

Cash distribution/dividends payment

(32,683)

(32,683)

(32,683)

Personnel cost for stock options

1,228

1,228

1,228

Expired stock options

(24,309)

24,309

Exercised stock options

(141)

141

Purchase of treasury shares – net

(4,684)

(9)

(4,693)

(4,693)

Total transactions with owners
of the Company

(4,684)

(23,222)

(8,242)

(36,148)

(36,148)

Net equity as at 30 June 2025

17,543,522

4,562

243,565

50,532

(108,793)

11,142

(54,345)

(223)

983

312,816

460,239

6,737

466,976

The accompanying notes form an integral part of the Half-Year Condensed Consolidated Financial Statements.

3.6 Notes to the Condensed Consolidated Financial Statements

1 General information

Cosmo N.V. (previously Cosmo Pharmaceuticals N.V.) with its subsidiaries and associates, (‘Cosmo’ or ‘Company’ or ‘Group’) is a speciality pharmaceutical company registered in the Netherlands with its seat of management at 7th Floor, One North Dock, 91/94 North Wall Quay, Dublin, Ireland, and is listed on the SIX Swiss Exchange (SIX: COPN). The Company has a Swiss branch located in Lugano, Switzerland. The Company is registered at the Dutch trade register under number 65617738.

Cosmo is a pharmaceutical company with a focus on gastrointestinal diseases, dermatology and healthtech. Cosmo develops and manufactures products which are distributed globally by its partners.

Since 12 March 2007, Cosmo’s shares have been publicly listed on the Swiss Stock Exchange (SIX: COPN). The Company’s stock market capitalisation as at 30 June 2026 was equal to CHF 1,166,644,213 (€1,264,792,078).

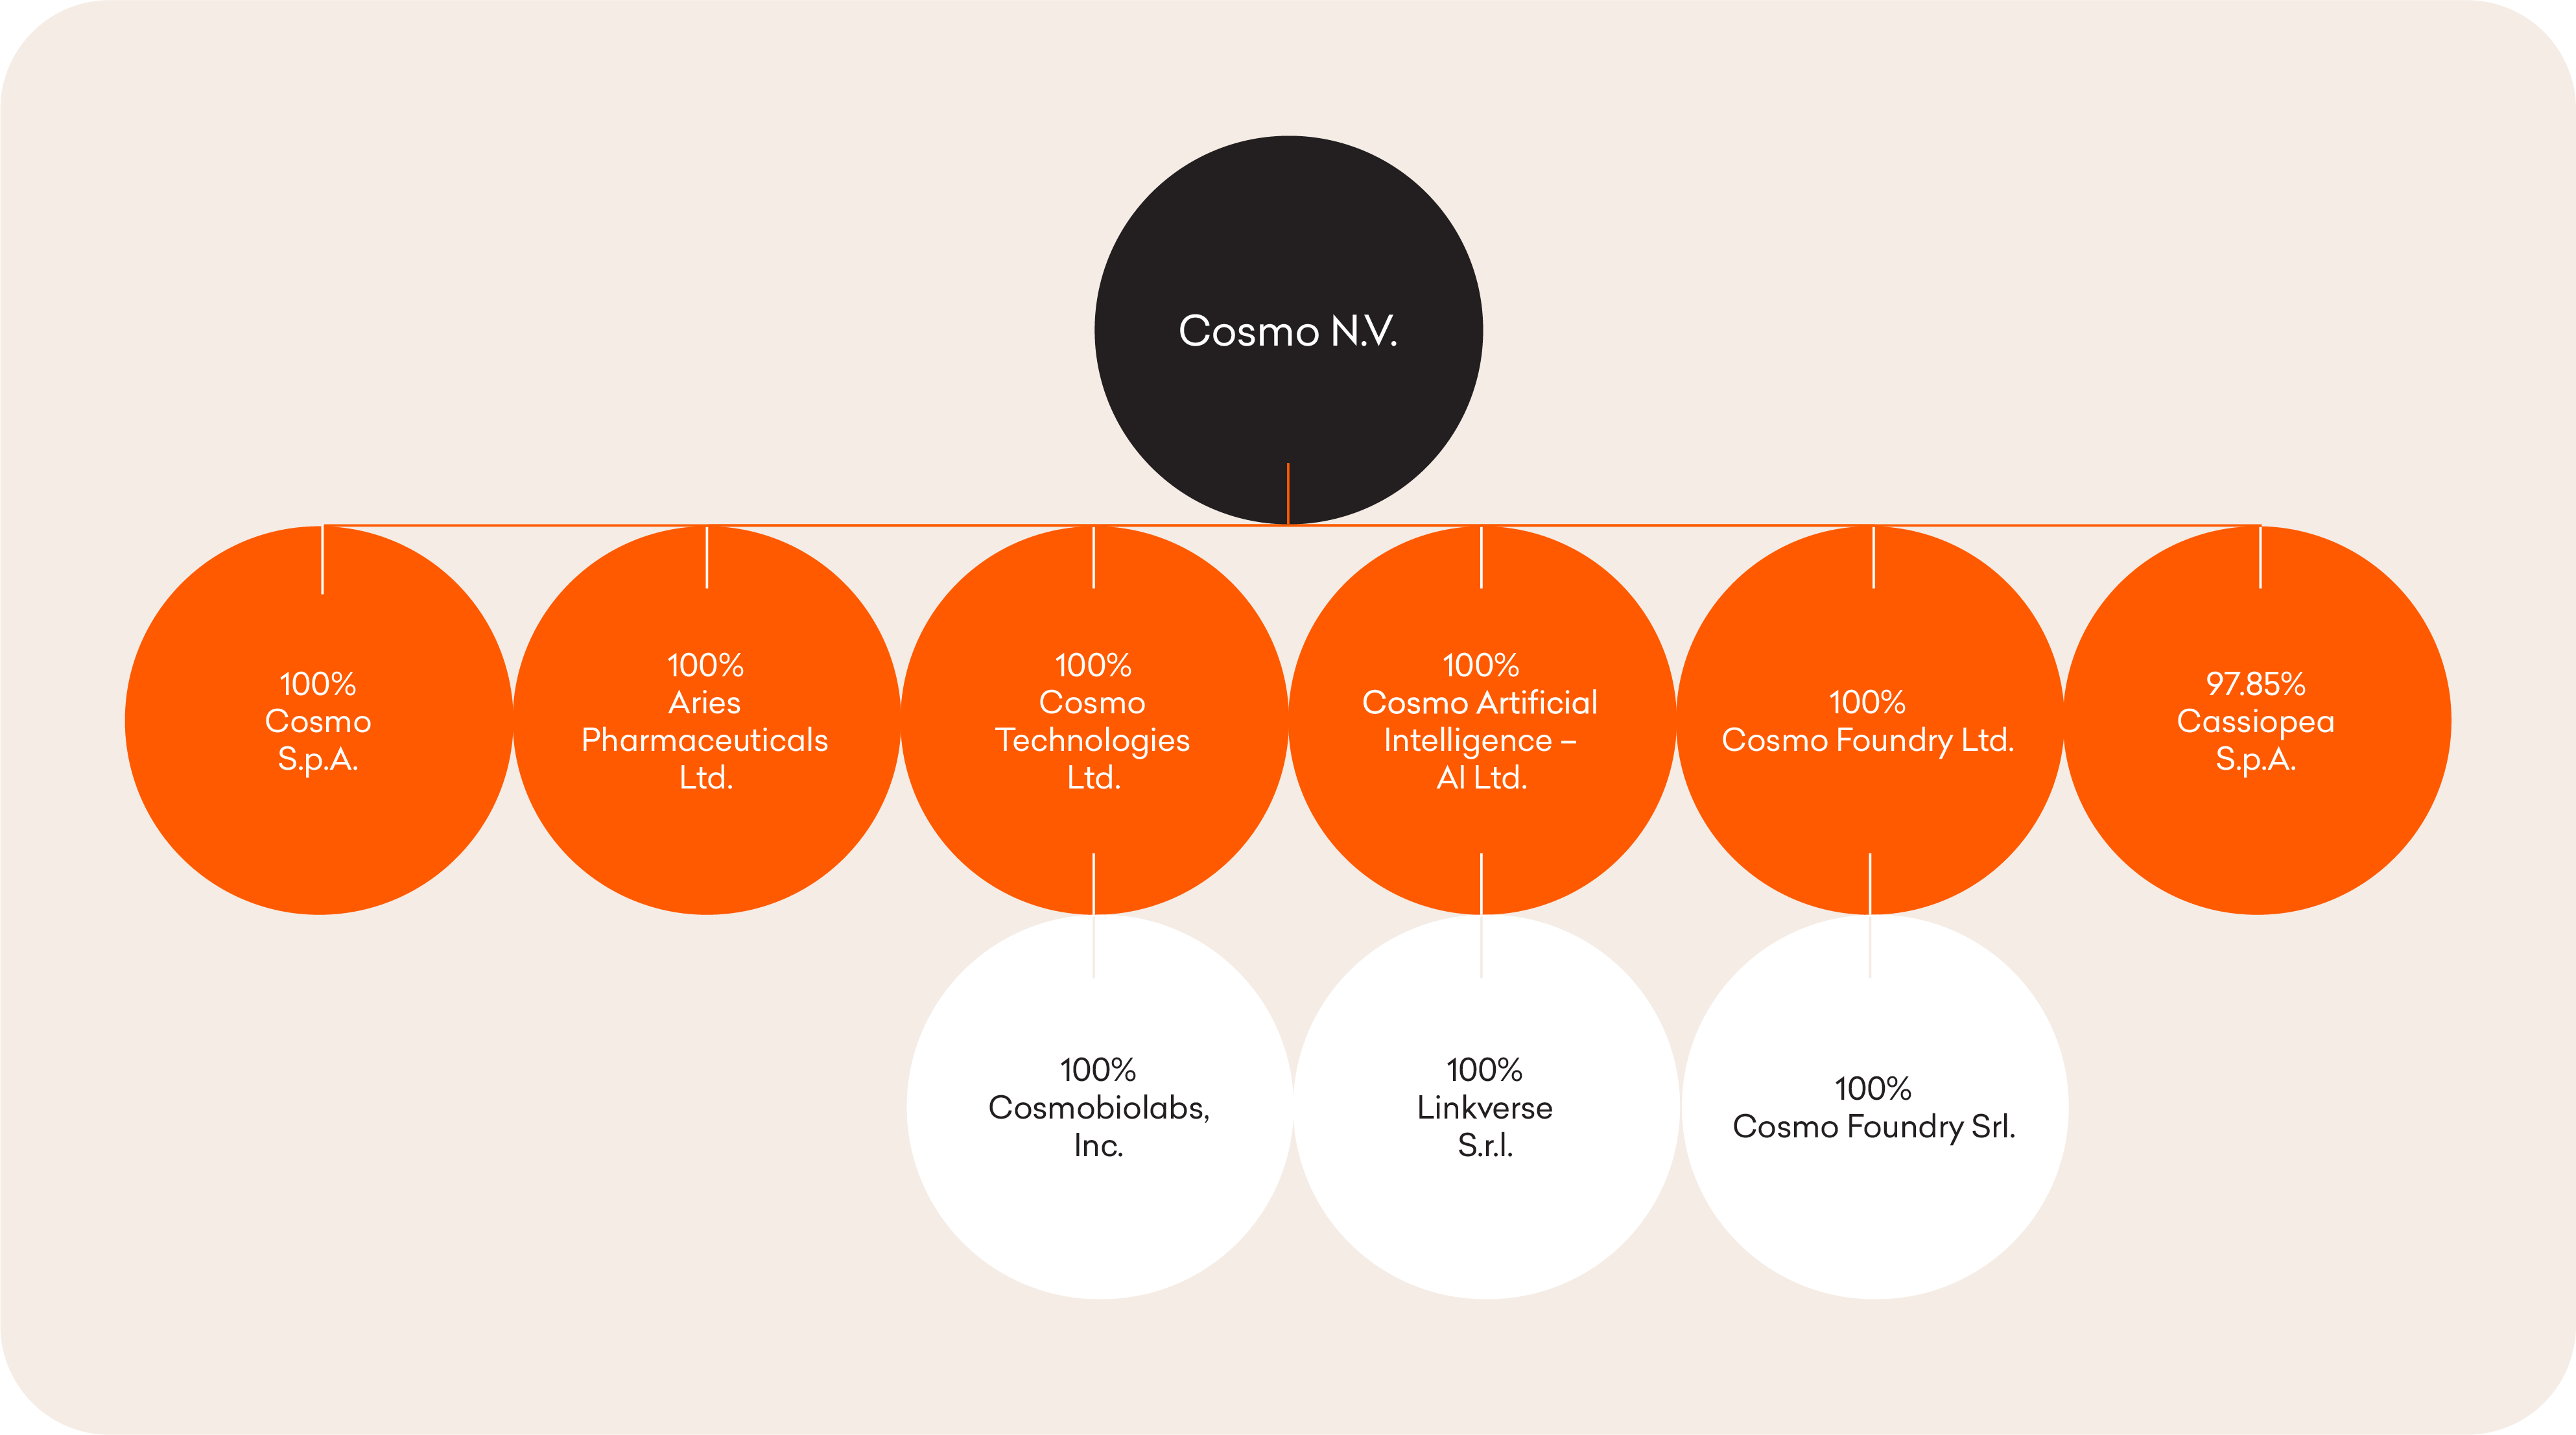
Group structure as of 30 June 2026:

Corporate structure chart showing Cosmo Pharmaceuticals N.V. and its ownership interests in seven subsidiaries, including six wholly owned entities and a 97.85% stake in Cassiopea S.p.A.

2 Basis of preparation

A Authorisation of Condensed Consolidated Financial Statements

These Half-Year Condensed Consolidated Financial Statements, together with notes, of Cosmo N.V. at 30 June 2026 were authorised for issuance by the Board of Directors on 21 July 2026.

B Basis of preparation

These half-year Condensed Consolidated Financial Statements have been prepared in accordance with IAS 34 Interim Financial Reporting. These interim statements do not include all the information and disclosures required in the annual financial statements, but they contain selected explanatory notes to highlight key events and transactions relevant to understanding changes in the Group’s financial position and performance since the last annual financial statements. Accordingly, these interim statements should be read in conjunction with the Group’s most recent annual Consolidated Financial Statements as at 31 December 2025 (‘last annual financial statements’).

These Half-Year Condensed Consolidated Financial Statements are prepared under the historical cost method, modified as required for the measurement of certain financial instruments, as well as on the basis that it will continue to operate as a going concern.

These Condensed Consolidated Financial Statements are expressed in thousands of Euros, unless stated otherwise, rounding the amounts to the nearest thousand.

3 Significant accounting policies

The accounting policies applied in the preparation of the Half-Year Condensed Consolidated Financial Statements are consistent with those followed in the preparation of the Group’s annual Consolidated Financial Statements for the year ended 31 December 2025, except for the adoption of new standards effective as of 1 January 2026. These new standards, amendments or interpretations do not have a material impact on the Group in the current or future reporting periods and on foreseeable future transactions.

New standards and amendments – applicable 1 January 2026:

  • Amendments to the Classification and Measurement of Financial Instruments - Amendments to IFRS 9 and IFRS 7
  • Annual Improvements to IFRS Accounting Standards - Amendments to IFRS 1, IFRS7, IFRS 9, IFRS 10 and IAS 7

4 Revenue

EUR 1,000

H1 2026

H1 2025

Recurring:

Manufacturing:

Manufacturing of own products

34,505

27,256

Manufacturing of generic products, speciality drugs and related services

7,697

6,746

Royalties

7,380

7,343

Other revenues from sales

-

580

Recurring revenue

49,582

41,925

Project -based:

Licence fees, up-front fees and milestones

653

9,795

Project-based revenue

653

9,795

Total revenue

50,235

51,720

EUR 1,000

H1 2026

H1 2025

GI Genius™ (Medtech AI)

9,157

8,714

Winlevi® (Derma)

10,215

7,409

Lialda®/Mezavant®/Mesavancol®

18,994

14,035

Uceris®/Cortiment®

2,356

2,416

Contract manufacturing (CDMO)

7,766

6,789

Others

1,094

1,982

Gastro & CDMO

30,210

25,222

Other revenue

580

Recurring revenue

49,582

41,925

Project-based revenue

653

9,795

Total revenue

50,235

51,720

Recurring Revenue

H1 2026 recurring revenue increased by 18% to €49.6 million (H1 2024: 41.9 million).

Gastro & CDMO and other recurring revenue increased by 20% to €30.2 million (H1 2025: €25.2 million), mainly due to higher volumes for Lialda/Mezavant/Mesavancol and contract manufacturing.

Winlevi (Derma) recurring revenue increased by 38% to €10.2 million (H1 2025: €7.4 million), driven by increase in supply sales and royalties.

GI Genius (Medtech AI) recurring revenue increased by 5% to €9.2 million in H1 2026 (H1 2025: €8.7 million), primarily driven by higher supply volumes.

Project-based Revenue

Project-based revenue in H1 2026 totaled €0.7 million (H1 2025: €9.8 million), comprising €0.6 million from Winlevi (Derma) milestone and €0.1 million for Rifamycin milestone. The H1 2025 project-based revenue was attributed to the €8.3 million sale of Digital Trust software.

5 Net expenses

Net expenses in the table below represent cost of sales and net operating expenses by nature of the expenses:

EUR 1,000

H1 2026

H1 2025

Other income

2,830

4,123

Changes in inventories of finished goods and work in progress

315

241

Raw materials and consumables used

(15,579)

(13,091)

Personnel expenses

(19,099)

(16,950)

Outsourced preclinical and clinical trial costs

(5,425)

(8,182)

Other operating expenses

(13,282)

(13,009)

Depreciation and amortisation

(6,602)

(6,263)

Total net operating expenses

(56,842)

(53,131)

A Raw materials and consumables used and changes in inventories

Expenditure on raw materials, consumables used and changes in inventory slightly increased to €2.4 million largely due to increased production volume across majority of product lines.

B Outsourced preclinical and clinical trial costs

This expenditure amounting to €5.4 million (H1 2025: €8.2 million) primarily relates to clinical trial and clinical study costs. The main drivers of this are the following projects: 

  • Clascoterone solution for Androgenetic Alopecia (‘AGA’) in males – phase III trials amounting to €2.0 million (H1 2025: €6.5 million),
  • Bile Acid Diarrhoea – phase II proof-of-concept study amounting to €1.1 million (H1 2025: €1.0 million),
  • Distal Ulcerative Colitis – phase II study amounting to €1.3 million (H1 2025: €0.8 million), and
  • Solid Tumours – phase I study amounting to €0.3 million (H1 2025: €0.7 million).

C Personnel expenses

EUR 1,000

H1 2026

H1 2025

Salaries and wages

10,748

10,348

Social security contributions

3,062

2,773

Incentives

2,565

2,175

Employee benefits

489

427

PSU/RSU long term incentives

442

Stock options

1,237

1,142

Other costs

556

85

Total personnel expenses

 19,099

16,950

Personnel expenses increased by €2.1 million, primarily due to additional headcount, incentives and severance costs.

The average number of staff for the period ended 30 June 2026 was as follows:

Average no. of staff by function

H1 2026

H1 2025

Research & Development

86.5

91.5

Production & Logistics

210.5

203.0

Selling, General, Adm. & Finance, IT and others

50.0

41.0

Total average number

347.0

335.5

The number of staff headcount as at 30 June 2026 was 365.

D Other operating expenses

EUR 1,000

H1 2026

H1 2025

Consultancy services and investor relations

3,328

4,128

Maintenance and utilities

3,043

3,152

Advertising and marketing

910

1,805

Patent costs

289

267

Audit fees

321

370

Sub-contracting and other services in relation to the manufacturing

358

606

Travel expenses

488

463

Software and hardware assistance costs

787

398

Freight and customs

303

305

Tax, other than income tax

149

158

Decommissioning costs

1,126

Rentals

183

119

Other costs

1,997

1,238

Total other operating expenses

 13,282

 13,009

6 Financial income and expenses

EUR 1,000

H1 2026

H1 2025

Financial income:

Interest received on cash and cash equivalents

404

278

Interest received on listed bonds and securities at FVOCI

166

443

Net foreign exchange gains

982

Gain on investments in funds mandatorily in FVTPL

1,641

1,890

Convertible bond at FVTPL – net change in fair value

23

Gain on sale of listed bonds at FVOCI

7

631

Total financial income

3,223

3,242

Financial expenses:

Interest on medium and long-term bank loan

(2)

(1)

Interest on financial lease payables

(110)

(62)

Net foreign exchange loss

(2,321)

Loss on investments in funds mandatorily in FVTPL

(135)

(81)

Loss on sale of listed bonds at FVOCI

(48)

(1)

Other

(109)

(35)

Total financial expenses

(404)

(2,501)

Net financial income/(expense)

2,819

741

Financial income remained stable at €3.2 million with the reduction of interest and gains on FVOCI investments offsetting the foreign exchange gains.

Financial expenses decreased to €0.4 million (H1 2024: €2.5 million), primarily driven by foreign exchange impact from the strengthening of USD against Euro.

7 Income tax expenses

A. Income tax recognised in profit or loss

EUR 1,000

H1 2026

H1 2025

Income tax

(2,832)

(1,487)

Changes in estimates related to prior years

70

Current income tax

(2,762)

(1,487)

Deferred tax assets

972

926

Deferred tax liabilities

847

(799)

Deferred tax

1,819

127

Total income tax

(943)

(1,360)

B. Income tax recognised in other comprehensive income

EUR 1,000

H1 2026

H1 2025

Deferred tax

Arising on income and expense recognised in other comprehensive income:

Fair value on remeasurement of equity instruments at FVOCI

185

19

Total income tax recognised in other comprehensive income

185

19

8 Basic and diluted earnings per share

A. Basic earnings per share

Basic earnings per share are calculated by dividing the net profit/(loss) for the period attributable to ordinary shareholders by the weighted average number of ordinary shares outstanding during the period. Basic earnings per share are as follows:

H1 2026

H1 2025

Net loss attributable to shareholders (in EUR 1,000)

(4,750)

(2,006)

Weighted average number of outstanding ordinary shares

17,042,708

15,970,541

Basic loss per share (in EUR)

(0.279)

(0.126)

B. Diluted earnings per share

Diluted earnings per share are calculated by dividing the net profit/(loss) for the year attributable to ordinary shareholders by the weighted average number of ordinary shares outstanding during the period, after adjustments for the effects of all dilutive potential ordinary shares. In relation to the stock option plans (see Note 15 for details), the potential number of ordinary shares is represented by the shares that would be issued as a consequence of the conversion of all options into ordinary shares.

Potential ordinary shares from the exercise of stock options only have a dilutive effect if the new ordinary shares from the exercise of stock options leads to a lower result of earnings per share.

H1 2026

H1 2025

Net loss attributable to shareholders (in EUR 1,000)

(4,750)

(2,006)

Weighted average number of outstanding ordinary shares

17,042,708

15,970,541

Incremental shares with dilutive effect

Adjusted weighted average number of outstanding ordinary shares

17,042,708

15,970,541

Diluted loss per share (in EUR)

(0.279)

(0.126)

9 Goodwill

The carrying amount of goodwill arises from the acquisitions of Cassiopea S.p.A. (‘Cassiopea’) in 2021 and Linkverse S.r.l. (‘Linkverse’) in 2018.

The carrying amount of goodwill is allocated to the following cash-generating units (‘CGUs’):

EUR 1,000

30-Jun-26

31-Dec-25

Winlevi®

11,283

11,283

Clascoterone solution for Androgenetic Alopecia in males

11,283

11,283

GI Genius™

1,439

1,439

Closing carrying amount

24,005

24,005

The Group tests whether goodwill has suffered impairment annually at year-end. As there were no indicators of impairment for any of the CGUs, management has not updated any of the impairment calculations.

10 Other intangible assets

EUR 1,000

30-Jun-26

31-Dec-25

Patents and rights

4,608

4,723

Winlevi® (U.S.) licensing and royalty agreements

95,292

98,374

Winlevi® (Non-U.S.)

51,068

51,671

Clascoterone solution for Androgenetic Alopecia in males 

170,268

170,268

Eleview® 

800

847

Total other intangible assets

322,036

325,883

Patents and rights relate to the cost of filing and extending patents owned by the Group. They are amortised over their useful lives based on their respective expiry dates.

Winlevi® and Clascoterone solution for Androgenetic Alopecia were acquired through the 2021 acquisition of Cassiopea.

Clascoterone solution for Androgenetic Alopecia in males is classified as In-Process Research and Development (IPR&D). Following Clascoterone solution's positive safety and efficacy results post Phase III trials, Cosmo is advancing preparations for a New Drug Application (NDA) in the United States and a Marketing Authorization Application (MAA) in Europe. A U.S. FDA filing is currently planned for early 2027.

Winlevi® (U.S. and non-U.S. rights) and Eleview® are classified as Marketed Products and are amortised over their estimated useful lives.

11 Financial assets

A Financial assets – non-current

EUR 1,000

30-Jun-26

31-Dec-25

Investment in bonds measured at FVOCI

10,472

5,580

Equity instruments measured at FVOCI – AIMM and RSouth shares

11,124

11,686

Equity instruments measured at FVOCI – Eagle Pharma shares

56

58

Equity instruments measured at FVOCI – RedHill shares

5

6

Equity instruments measured at FVOCI – PAION AG shares

30

5

Non-current financial assets

21,687

17,335

Investments in bonds measured at FVOCI amounting to €10.5 million (2025: €5.6 million) relate to long-term, high-grade corporate bonds. These bonds have credit ratings ranging from BBB- to A+ and are quoted using closing prices in the regulated market.

The equity instruments at FVOCI represent investments that the Group intends to hold long-term for strategic purposes. The equity instruments are measured at fair value using market rate as of reporting date except for the AIMM and RSouth shares which are measured at fair value using value-in-use approach (DCF).

B Financial assets – current

EUR 1,000

30-Jun-26

31-Dec-25

Investment in funds measured at FVTPL

148,790

65,682

Investment in bonds measured at FVOCI

15,112

1,212

Current financial assets

163,902

66,894

Investments in funds consist of investments in ‘Money market’, ‘Corporate short duration’ and ‘Floating rate credit’ funds. Gains and losses arising from the adjustment to the fair value were recognised in profit and loss.

The Group sold €15.8 million worth of investment in bonds and funds in H1 2026.

12 Total shareholders’ equity

EUR 1,000

30-Jun-26

31-Dec-25

Share capital

4,562

4,562

Share premium

243,565

243,565

Other reserves

47,845

47,845

Legal reserves

2,687

2,687

Treasury shares

(25,495)

(91,718)

Share-based payment reserve

9,275

7,999

Fair value reserve

(49,896)

(49,516)

Employee benefits actuarial gains/losses reserve

(213)

(212)

Currency translation reserve

1,326

986

Retained earnings

336,337

319,592

Profit for the period

(4,731)

(3,490)

Equity attributable to owners of the Company

565,262

482,300

Non-controlling interest

6,690

6,879

Total equity

571,952

489,179

A Share capital

Ordinary
shares

Preference shares

In issue at 1 January 2025 – fully paid

17,543,522

17,543,522

Exercise of share options

In issue at 30 June 2025 – fully paid

17,543,522

17,543,522

Authorised at 31 December 2024 – par value €0.26

36,047,457

36,047,457

In issue at 1 January 2026 – fully paid

17,543,522

17,543,522

Exercise of share options

In issue at 30 June 2026 – fully paid

17,543,522

17,543,522

Authorised at 30 June 2026 – par value €0.26

36,047,457

36,047,457

No new shares were issued upon the exercise of share options; the corresponding shares were sourced from treasury shares.

B Treasury shares

As at 30 June 2026, the Group held 353,028 treasury shares at an average purchase price of CHF 74.16 (€72.22) per share.

The number of issued shares, after adjusting for treasury shares, was as follows:

EUR 1,000

Ordinary
shares

In issue at 1 January 2025 – fully paid

17,543,522

Treasury shares

(1,528,426)

Outstanding at 1 January 2025 – fully paid

16,015,096

Treasury shares sold

135,352

Treasury shares purchased

(123,597)

Treasury shares issued for exercise of share options

163,924

Outstanding at 31 December 2025

16,190,775

In issue at 1 January 2026 – fully paid

17,543,522

Treasury shares

(1,352,747)

Outstanding at 1 January 2026 – fully paid

16,190,775

Treasury shares sold

1,039,724

Treasury shares purchased

(44,686)

Treasury shares issued for exercise of share options

4,681

Outstanding at 30 June 2026

17,190,494

C Share-based payment reserve

The stock option plan reserve relates to the stock option plan and PSU/RSU long-term incentive plan of Cosmo N.V. Refer to Note 15 for further details.

D Fair value reserve

The fair value reserve comprises the cumulative net change in the fair value of equity and bond investments designated at FVOCI.

E Dividend

In H1 2026, a cash distribution out of Cosmo’s freely distributable reserves in the amount of €2.10 per ordinary share on the 17,194,358 shares outstanding as at 24 April 2026 (ex-distribution date), was approved at the Annual General Meeting on 10 April 2026. The Company paid €27.1 million, net of withholding tax, in May 2026. The withholding tax of €9.0 million was paid in June 2026.

F Non-controlling interest

Non-controlling interest refers to minority interest in Cassiopea, representing 2.15% of the equity interest of Cassiopea as of 30 June 2026.

13 Loans and borrowings (non-current and current)

A Non-current

EUR 1,000

30-Jun-26

31-Dec-25

Bank loans

143

143

Lease liabilities

3,445

3,413

Total interest-bearing loans and borrowings (non-current)

3,588

3,556

B Current

EUR 1,000

30-Jun-26

31-Dec-25

Bank loans

141

141

Lease liabilities

585

568

Total interest-bearing loans and borrowings (current)

726

709

Non-current and current bank loans pertain to borrowings from UBI Banca.

14 Other liabilities (non-current and current)

A Non-current

EUR 1,000

30-Jun-26

31-Dec-25

Contingent consideration

631

676

Other liabilities

126

123

Total other non-current liabilities

757

799

Contingent consideration represents amounts payable to a former Linkverse S.r.l. NCI shareholder, conditional upon the achievement of future regulatory and commercial milestones. This liability is mandatorily measured at fair value through profit or loss (FVTPL).

B Current

EUR 1,000

30-Jun-26

31-Dec-25

Social security payables

1,000

975

Withholding tax for employees

952

1,581

Other liabilities

6,044

9,421

Accrued expenses and deferred income

894

892

Total other current liabilities

8,890

12,869

Other liabilities mainly include payables to employees related to accruals of deferred pay elements, calculated on the basis of the collective labour agreement currently in force and accrued employee bonuses.

15 Share-based payments

During the period Cosmo N.V. had the following equity-settled arrangements:

• Stock Option Plan

• Restricted Stock Unit (‘RSU’) Plan

• Performance Stock Unit (‘PSU’) Plan

The total share-based payment expenses recognised in the income statement were:

EUR (in thousands)

30 June 2026

30 June 2025

Stock options

1,330

1,228

Restricted Stock Units

352

Performance Stock Units

106

Total share-based payment expense

1,788

1,228

Stock Option Plan

Number

Weighted average exercise price

(CHF)

Outstanding as at 1 January 2026

703,577

61.41

Granted during the period

15,000

105.4

Forfeited during the period

Exercised during the period

(25,200)

60.57

Expired during the period

(5,333)

80.30

Outstanding as at 30 June 2026

688,044

62.25

Exercisable as at 30 June 2026 (included in above total)

191,332

68.70

Number

Weighted average exercise price

(CHF)

Outstanding as at 1 January 2025

1,276,891

71.02

Granted during the period

204,467

53.25

Forfeited during the period

(15,999)

62.57

Exercised during the period

(46,667)

64.00

Expired during the period

(390,941)

78.77

Outstanding as at 30 June 2025

1,027,751

64.99

Exercisable as at 30 June 2025 (included in above total)

403,007

73.01

The following is a breakdown of the outstanding share options of Cosmo N.V. as at 30 June 2026.

Option series

Issue date

Number

Grant date

Vesting date

Expiry date

Exercise price
(CHF)

Fair value1
(CHF)

12

13 March 2019

43,746

13/03/2019

13/03/2024

13/03/2027

83.15

21.29

21

25 January 2021

52,000

25/01/2021

25/01/2024

24/01/2027

80.30

17.64

24

31 January 2022

31,800

31/01/2022

31/01/2025

30/01/2028

57.20

13.31

26

31 January 2023

107,532

31/01/2023

31/01/2026

30/01/2029

66.50

18.58

28

8 December 2023

90,000

08/12/2023

08/12/2027

07/12/2030

43.90

13.28

29

31 January 2024

108,999

31/01/2024

31/01/2027

30/01/2030

64.00

16.09

30

5 July 2024

41,000

05/07/2024

05/07/2027

04/01/2023

72.40

18.38

31

3 January 2025

25,400

03/01/2025

03/01/2028

02/01/2031

64.20

16.64

32

4 April 2025

167,567

04/04/2025

04/04/2028

03/04/2031

51.70

13.04

33

7 August 2025

5,000

07/08/2025

07/08/2028

06/08/2031

55.70

13.97

34

5 January 2026

15,000

05/01/2026

05/01/2029

04/01/2032

105.4

28.26

Outstanding as at 30 June 2026

688,044

1 At grant date.

In H1 2026, Cosmo granted 15,000 share options under Option Series 34. The table below outlines the inputs used to measure the fair value at the grant date for these options under the Cosmo N.V. stock option plan:

Option series

34

Issue date

05/01/2026

Share price at grant date (in CHF)

105.40

Exercise price (in CHF)

105.40

Expected volatility

33.00%

Employee exit rate

0.00%

Option life

1097 days

Risk-free interest rate

2.9315%

Dividend yield

2.00%

The fair value of the options granted has been determined on the basis of the binomial tree generated by the Fincad programme, a technique similar to the Black-Scholes valuation model. The expected volatility of the underlying instrument measures the expected fluctuations in price/value for a given period. The indicator that measures volatility in the model used to evaluate the options is the annualised standard deviation of the compound returns of a share.

Long-Term Equity Incentive Plan (LTIP)

Effective 13 April 2026, Cosmo introduced the 2026–2029 Long-Term Equity Incentive Plan (LTIP), under which selected employees, executive directors, non-executive directors and consultants may receive equity-settled awards in the form of Restricted Stock Units (RSUs) and Performance Stock Units (PSUs).

RSUs vest over a three-year service period, while PSUs vest at the end of a three-year performance period subject to continued service and the achievement of predetermined performance conditions. For the 2026 grant, performance is measured based on Adjusted EBITDA (50%) and R&D Innovation Score (50%), with vesting ranging from 0% to 200% of the target award. The LTIP is accounted for as an equity-settled share-based payment arrangement in accordance with IFRS 2.

Number of shares

RSU

PSU

Granted on 13 April 2026

29,096

16,187

Forfeited

Vested

Outstanding at 30 June 2026

29,096

16,187

The fair value of RSUs and PSUs were determined at the grant date and measured using the Fair Market Value of the Company's ordinary shares as defined in the LTIP, being the average closing price of the shares over the ten trading days immediately preceding the Annual General Meeting.

The performance conditions of the PSUs relate to internal financial and operational measures and are therefore treated as non-market performance conditions under IFRS 2. Consequently, they do not affect grant-date fair value but are reflected in the estimate of the number of awards expected to vest.

The fair value of RSUs and PSUs granted during H1 2026 was CHF 84.20 per unit. RSU expense recognised during H1 2026 was €0.4 million. PSU expense recognised during H1 2026 was €0.1 million. Non-market performance conditions are reassessed each reporting period.

16 Related party transactions

At 30 June 2026, Cosmo Holding S.a.r.l., a Luxembourg company controlled by Mauro S. Ajani, the Chairman of the Company, held 6,086,702 shares in the Company.

Any member of the Board who has an interest in a related party transaction which is under discussion by the Board must abstain from this discussion and abstain from any vote on the approval of the related party transaction under discussion.

17 Fair value measurement

A Qualitative information

The fair value is the price that would be received when selling an asset or paid when transferring a liability in an orderly transaction between market participants (i.e. not as part of the compulsory liquidation or a below cost sale) as at the measurement date. Fair value is a market measurement criterion, not specifically referring to a single entity. Underlying the definition of fair value is the assumption that the Company is carrying out normal operations, without any intention of liquidating its assets, significantly reducing the level of operations or carrying out transactions at unfavourable conditions.

An entity has to measure the fair value of an asset or liability by adopting the assumptions that would be used by market participants when pricing an asset or liability, presuming that they act with a view to satisfying their own economic interest in the best way possible.

The fair value of financial instruments is determined according to a hierarchy of criteria based on the origin, type and quality of the information used (IFRS 13). In detail, this hierarchy assigns top priority to quoted prices (unadjusted) in active markets and less importance to unobservable inputs. Three different levels of input are identified:

  • level 1: input represented by quoted prices (unadjusted) in active markets for identical assets
    or liabilities accessible by the entity as at the measurement date;
  • level 2: input other than quoted prices that are directly or indirectly observable for
    the assets or liabilities to be measured; and
  • level 3: unobservable input for the asset or liability.

A market is regarded as active if quoted prices, representing actual and regularly occurring market transactions considering a normal reference period, are readily and regularly available from an exchange, dealer, broker, industry group, pricing service or regulatory agency.

In specific cases, research is carried out in order to verify the significance of official market values. In the event of a significant reduction in the volume or level of operations compared with normal operations for the asset or liability (or for similar assets or liabilities) highlighted by a number of indicators (number of transactions, limited significance of market prices, significant increase in implicit premiums for liquidity risk, expansion or increase of the bid-ask spread, reduction or total lack of market for new issues, limited publicly-available information), analyses of the transactions or of the quoted prices are carried out: if the conclusion is reached that the market is inactive, the asset or liability is reclassified to level 2 of the fair value hierarchy.

The following table shows the fair value hierarchy for financial assets and financial liabilities that are measured at fair value on a recurring basis:

30-Jun-26

31-Dec-2025

EUR 1,000

Level 1

Level 2

Level 3

Total

Level 1

Level 2

Level 3

Total

Non-current financial
assets

Investment in bonds

10,472

10,472

5,580

5,580

Investment in equity instruments

91

11,124

11,215

69

11,686

11,755

Current financial assets

Investment in funds

148,790

148,790

80,682

80,682

Investment in bonds

15,112

15,112

17,985

17,985

Total financial assets

174,465

11,124

185,589

104,316

11,686

116,002

Contingent consideration and other liabilities

(631)

(631)

(676)

(676)

Total financial liabilities

(631)

(631)

(676)

(676)

B Assets and liabilities that are measured at fair value on a recurring basis

The following are considered as level 1 financial instruments:

  • shares valued using official closing prices and/or fixing provided by regulated stock exchanges;
  • bonds and shares of funds valued using official closing prices and/or fixing provided by local authorities (central bank, monetary authority or local stock exchange); and
  • investments in funds quoted on Multilateral Trading Facility (i.e. the EuroTLX or NASD TRACE circuit) or for which it is possible to continuously derive the quotation from the main price contribution international platforms.

When no quotation on an active market exists or the market is not functioning regularly, that is, when the market does not have a sufficient and continuous number of trades, and bid-ask spreads and volatilities that are not sufficiently contained, the fair value of the financial instruments is mainly determined through the use of valuation techniques whose objective is the establishment of the price at which, in an orderly transaction, the asset could be sold or the liability transferred between market participants, as at the measurement date, under current market conditions.

In the case of level 2 inputs, the valuation is based on prices taken from official listings of instruments which are similar in terms of risk profile. There are no level 2 financial assets as at 30 June 2026.

Level 3 consist of the following:

  • equity investments for which there is no quoted market price in an active market. The fair value has been calculated using a value in use approach (‘DCF’) model, which considers the present value of expected future cash flows, discounted using a risk-adjusted discount rate of 10.00%. The estimated fair value would increase (decrease) if the expected cash flows were higher (lower) or if the risk-adjusted discount rate were lower (higher). The resulting fair value calculation resulted to an immaterial increase in the carrying value of the investment, however the change was not recognised in the financial statements for prudence;
  • contingent consideration in relation to the acquisition of Linkverse S.r.l. The present value of future expected payments (expected payments discounted using a risk-adjusted discount rate of 4.98%) have been recorded as contingent consideration. These payments are contingent upon occurrence of future events such as regulatory approval milestones and commercial milestones. The estimated present value would increase (decrease) if the expected payments were higher (lower) or if the risk-adjusted discount rate were lower (higher).

During H1 2026, there were no significant transfers between levels 1 and 2 or between level 2 and 3 in the fair value hierarchy and the changes were due to a change in the market values.

C Assets and liabilities not measured at fair value on recurring basis

This table shows the comparison of fair values versus carrying amounts of financial assets and liabilities not measured at fair value, as required by IFRS 7.

30-Jun-26

31-Dec-2025

EUR 1,000

Classification

Carrying amount

Fair value

Carrying amount

Fair value

Trade receivables

Amortised cost

29,715

29,715

24,143

24,143

Cash and cash equivalents

Amortised cost

30,775

30,775

55,865

55,865

Total assets

60,490

60,490

80,008

80,008

Subsidised loans

Amortised cost

(284)

(278)

(284)

(278)

Trade payables

Amortised cost

(14,157)

(14,157)

(11,327)

(11,327)

Other current liabilities1

Amortised cost

(6,935)

(6,935)

(10,313)

(10,313)

Total liabilities

(21,376)

(21,370)

(21,924)

 (21,918)

Unrecognised gain

6

6

1 Only financial liabilities.

For financial instruments represented by trade receivables, trade payables and other current liabilities, for which the present value of future cash flows is also taking into account the credit risk of the counterparties, does not differ significantly from carrying value, we assume that the carrying value is a reasonable approximation of the fair value.

The carrying amount of cash and cash equivalents, which consist primarily of bank current accounts and time deposits, approximates fair value.

For lease liabilities, unsecured bank loans, the carrying amount represents the fair value calculated based on the present value of future principal and interest cash flows, discounted at the Group’s incremental borrowing rate.

The fair value of subsidised loans, included at level 2, has been estimated with discounted cash flow models. The main inputs used are year-end market interest rates.


18 Events after the reporting period

In July 2026, Cosmo acquired a minority equity stake in Scialytics SAS. (“Scialytics”), a developer of artificial intelligence (AI) software that assists surgeons in real time during minimally invasive procedures. The investment was completed through subscription of shares for a total consideration of €3 million. As the transaction occurred after the reporting date, it has not been recognised in these interim financial statements.

No material adjusting events occurred after the reporting period of 30 June 2026.

The Board of Directors

Mauro Ajani

Alessandro Della Chà

Giovanni Di Napoli

John O’Dea

Silvana Perretta

Maria Grazia Roncarolo

Dublin, Ireland, 21 July 2026

3.7 Contacts and Addresses

Cosmo N.V.

7th floor

One North Dock

91/94 North Wall Quay 1

Dublin 1

D01 H7V7

Ireland

Investor relations, publications and further information